theSome products pass every reliability test on paper, but still fail in the field. If you’ve worked in engineering, product design, or field maintenance, you’ve probably seen it happen. A system clears MIL-HDBK-217 estimates. The lab results check out. The vendor claims 100,000 hours MTBF. And yet, within weeks of deployment, units begin to return.
Not because someone skipped the testing phase. Not because the components were cheap. But because the reliability model used didn’t match the reality in which the product was entering.
This isn’t about one bad guess. It’s about systemic mismatch—and the need for a clearer, more grounded reliability models comparison.
The Disconnect Between Prediction and Reality
Reliability models were built to help teams plan ahead. That’s their purpose: to estimate failure rates, anticipate support needs, and reduce surprises. But when these models are built on assumptions that don’t reflect the real world, they create blind spots.
For example, many reliability predictions are based on ideal lab conditions. The temperature is constant. Voltage is stable. Vibration, if tested at all, is applied in controlled, repeatable cycles. But in actual use?
- Temperatures fluctuate.
- Voltage spikes hit out of nowhere.
- Users drop the equipment or install it wrong.
- Systems are powered on and off irregularly.
This mismatch can make a “reliable” product look unstable once it leaves the building. And it’s not just theory. Teams in aerospace, automotive, telecommunications, and medical devices have experienced failures that were never supposed to occur.
So what gives?
A Closer Look at Popular Reliability Models
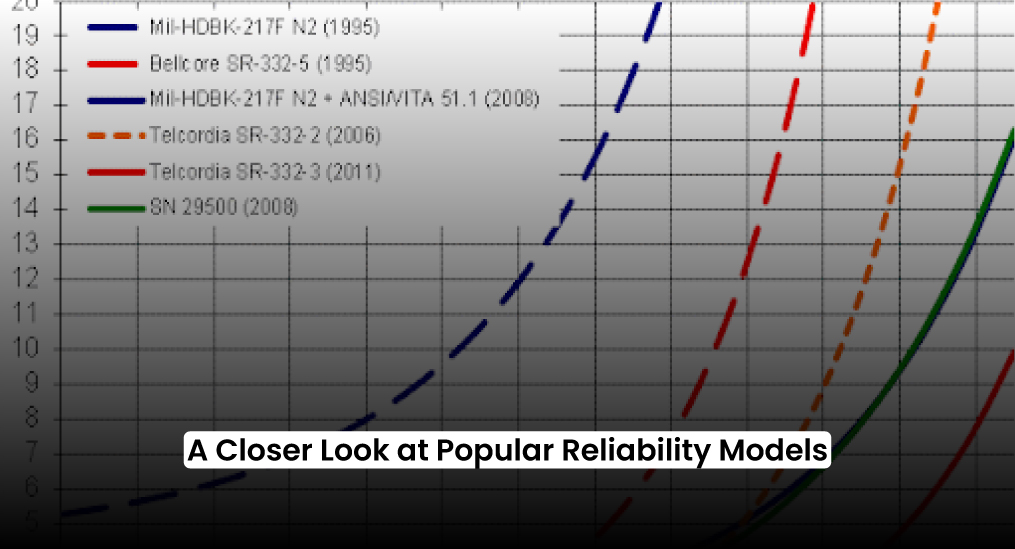
Let’s walk through a reliability models comparison of the most commonly used approaches. The goal here isn’t to discredit them. It’s to understand what they assume—and what they leave out.
1. MIL-HDBK-217 (and 217Plus)
Strengths:
- Widely used in defense and aerospace
- Structured, standardized failure rate formulas
- Good baseline for comparing parts
Gaps:
- Based on aging component libraries
- Assumes constant temperature, voltage, and load
- Doesn’t reflect modern use environments (e.g. mobile devices, high-frequency switching)
That’s why so many teams continue to default to MIL-HDBK-217, even when the real-world behavior of the system has outgrown what that model was built to simulate.
What happens in practice:
A power supply rated under MIL-HDBK-217 may perform fine on paper but fail under high thermal cycling or mechanical stress in the field.
2. Telcordia SR-332
Strengths:
- Tailored to telecom systems
- Provides equations for failure rate calculations
- Includes environment-based failure rate adjustments
One reason teams still rely on Telcordia SR-332 is that it offers structured failure rate equations that feel more predictable, even when they don’t always capture edge-case scenarios.
Gaps:
- Still assumes normal operating conditions
- Less flexible for non-telecom systems
- Limited ability to model extreme or intermittent loads
In the field:
Telecom equipment designed with SR-332 may not handle sudden current surges or outdoor deployments without unexpected issues.
3. FIDES Methodology
Strengths:
- Developed by European aerospace and defense experts
- Focuses on process quality and system environment
- Accounts for real-world use, including human factors
Gaps:
- Requires more input and effort from the team
- Not as widely adopted outside Europe
- Some learning curve for teams used to MIL-HDBK or Telcordia
Bottom line:
FIDES often uncovers problems traditional models miss, especially in harsh or variable environments.The strength of FIDES lies in how it forces teams to think beyond numbers and consider the human, environmental, and process factors that quietly shape real-world failures.
4. Physics-of-Failure (PoF)
Strengths:
- Models the actual physical degradation of parts
- Based on materials science, not historical averages
- Useful for new technologies or unknown stress profiles
Gaps:
- Requires in-depth material knowledge
- More expensive and time-consuming to run
- Not always feasible for fast product cycles
When it works best:
In cutting-edge electronics or mission-critical hardware, failure modes are complex and unpredictable.
The Gaps You Can’t Afford to Ignore

This is where the real problem lies: different reliability models tell different stories. You can follow all the right steps according to one model and still miss what another one would have caught.
A team might use MIL-HDBK-217 and feel confident that their system is solid. However, the same system might exhibit signs of stress under a FIDES analysis. A reliability models comparison shows that it’s not always about one being right and the others wrong. It’s about what each model can’t see.
If your model doesn’t account for:
- Installation error
- Transportation vibration
- Operator misuse
- Field maintenance mistakes
- Thermal cycling beyond normal lab ranges
then your design may still fail, no matter how reliable it looks in Excel.
When the Model Becomes a Crutch
One of the quiet dangers in engineering is leaning too hard on a single reliability figure. “The MTBF is 150,000 hours” becomes a safety blanket. Procurement teams use it for supplier selection. Marketing teams quote it on slides. Executives use it to forecast service costs.
But if that number came from a model that doesn’t match the real operating profile, it can mislead everyone.
A reliability models comparison shows how easy it is to fall into this trap. Some models downplay early-life failures. Others assume constant loads that don’t exist in actual operation. Some fail to capture environmental interactions altogether.
Real-World Story: Server Room vs. Construction Site
A rugged tablet rated under MIL-HDBK-217 was deployed for a client in both environments: indoor server rooms and outdoor construction sites.
In the server room, no issues. In the field, the failure rate tripled. Why?
The model assumed stable conditions. But field workers used the tablet in 42°C heat, dropped it often, and recharged it using inconsistent power sources. The model didn’t account for any of that. A FIDES-based approach or a PoF analysis would’ve flagged the risk earlier.
What a Better Reliability Strategy Looks Like
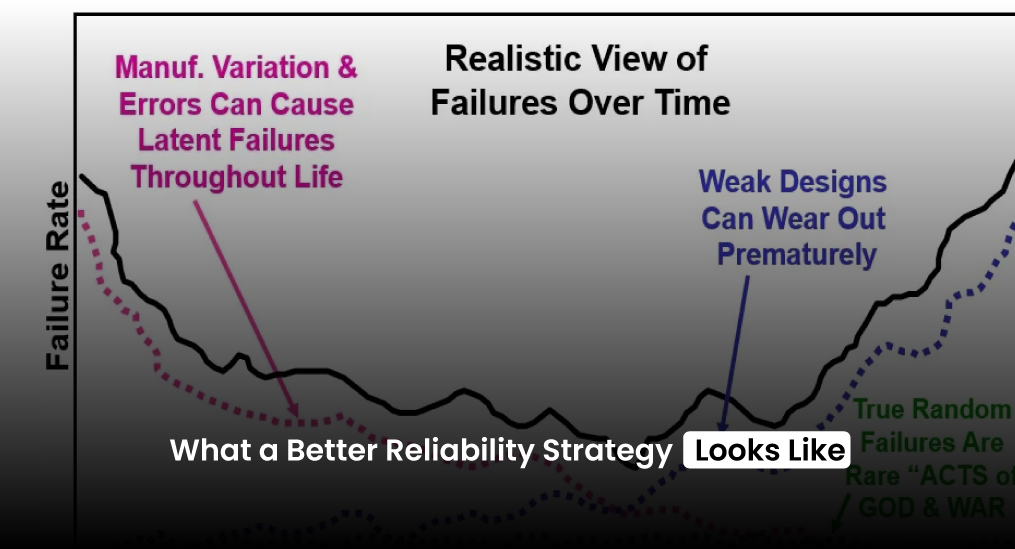
If you want to reduce in-field failures, the answer isn’t to ditch all models. It’s to use them intentionally, with a clear eye on what they cover—and what they don’t.
Here’s how experienced teams use reliability modeling more effectively:
- Use Multiple Models
Don’t rely on just one prediction tool. A good reliability model comparison involves MIL-HDBK-217 for baseline estimates, Telcordia for telecom applications, FIDES for field realism, and PoF, where failure mechanisms are complex. - Match the Model to the Use Case
If you’re designing for rugged field use, lab-based models will always fall short. You need an approach that includes environment, handling, and maintenance assumptions. - Build in Feedback Loops
Use real-world field data to revise your predictions. Look at RMAs. Track repair logs. Collect feedback from both installers and end-users. - Don’t Let a Single MTBF Number Drive the Decision
MTBF isn’t the finish line. It’s just a part of the picture. Always ask: How was this number calculated? Under what assumptions? Are those assumptions valid? - Consider Human Factors
This is where most models fall flat. People make mistakes, ignore procedures, or use products in unintended ways. If your reliability plan doesn’t account for that, it’s not complete.
A Reliability Models Comparison That Matters
The reason this matters isn’t academic. It’s practical. Every team that sends a product into the world wants it to work. They want fewer support calls. Fewer warranty claims. More trust from customers.
That’s only possible when your reliability model reflects reality, not just theory.
A smart reliability model comparison lays the blind spots bare. It lets you ask: “What aren’t we seeing?” And from there, you can design better, test smarter, and plan with more confidence.
No model can see the future. Every prediction is just that—a prediction. The best reliability engineers know that. They treat the models as tools, not truth. They ask the questions that others often skip then test for what shouldn’t happen. Those assume surprises.
If your goal is fewer failures, that’s the mindset to adopt. Not blind confidence in numbers, but awareness of where numbers fall short.
When you base your decisions on a true reliability models comparison, you see what’s missing. And once you see the gaps, you can close them.
That’s what real reliability looks like.